
ChartJS | How to draw Bar graph using data from MySQL table and PHP
ChartJS
In this tutorial we are learning to draw Bar Graph using data from MySQL table and PHP.
Using ChartJS 2.x Download
Note! You can get the code of this tutorial from my GitHub repository.
Requirement
We will need the following items to complete this tutorial.
- Text Editor like SublimeText, TextMate, Coda, NotePad++ or IDE like Eclipse
- Web Browser like Chrome or Firefox
- PHP development environment on your localhost. For this you can use XAMPP (Windows/Linux/OS X users) or MAMP (Windows/OS X users)
- MySQL
- ChartJS
- jQuery
So lets get started...
MySQL table
For this tutorial we will consider a very simple score table having two columns playerid and score and 5 entries.
Score table
CREATE TABLE `score` (
  `playerid` int(10) unsigned NOT NULL AUTO_INCREMENT,
  `score` int(11) DEFAULT '0',
  PRIMARY KEY (`playerid`)
) ENGINE=InnoDB DEFAULT CHARSET=utf8;
Score table data
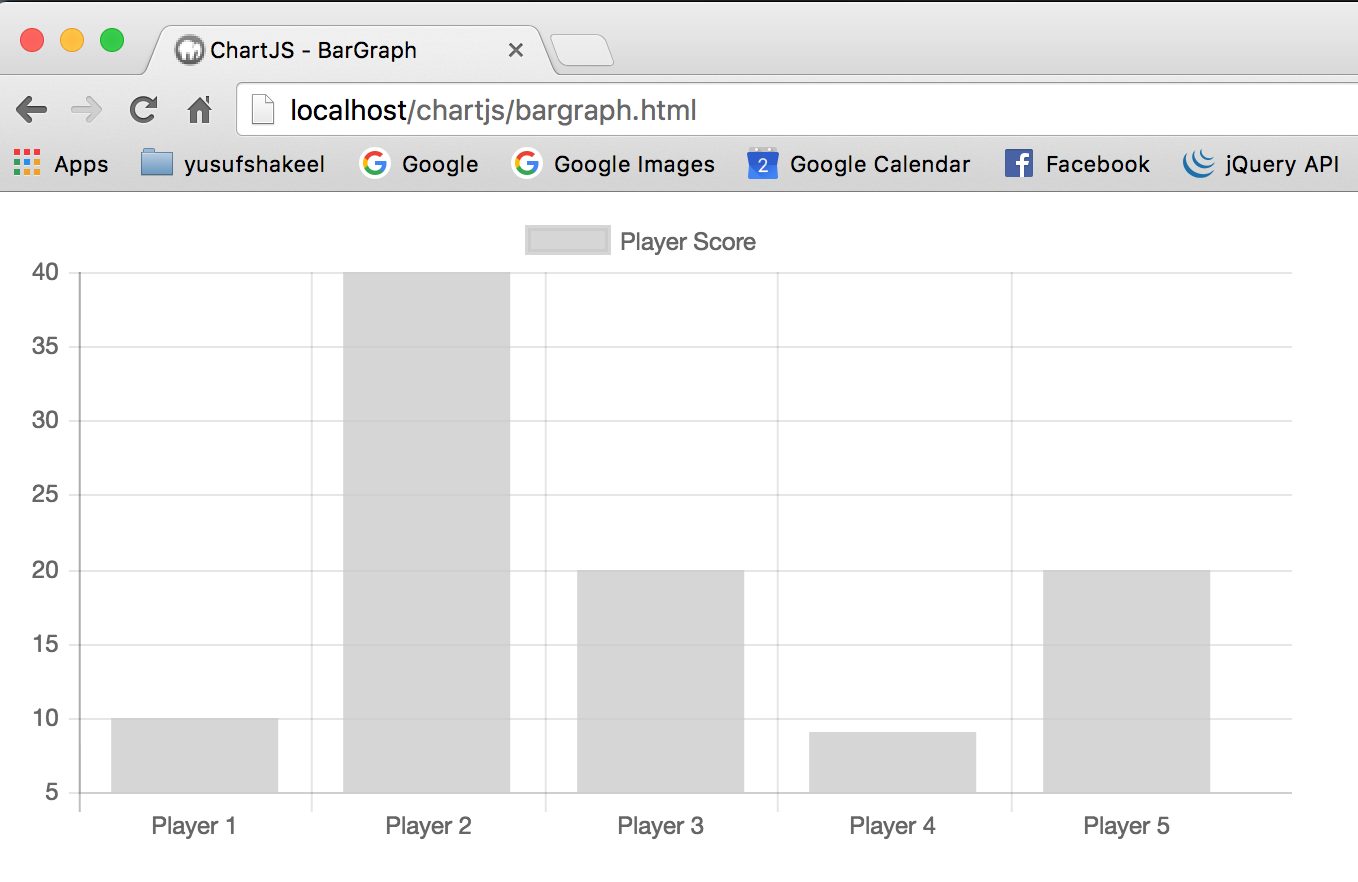
INSERT INTO `score` VALUES (1,10),(2,40),(3,20),(4,9),(5,20);
Create a New Project
Create a new project folder and name it chartjs. Note! Feel free to name your project as per your choice. Inside the chartjs project folder create a subfolder and name it js. This will hold all the javascript files.
Moving the JS files in the js folder
Copy the Chart.min.js and jquery.min.js files inside the js folder that we created inside the chartjs project folder. And create an app.js file inside the js folder. This will contain all the javascript code that we are going to write for this project.
Create data.php file to fetch data from MySQL table
Create a new file data.php inside the chartjs folder. This file is going to contain php code that will fetch data from the score table and display it in JSON format.
File: data.php
<?php
//setting header to json
header('Content-Type: application/json');

//database
define('DB_HOST', '127.0.0.1');
define('DB_USERNAME', 'root');
define('DB_PASSWORD', 'root123');
define('DB_NAME', 'mydb');

//get connection
$mysqli = new mysqli(DB_HOST, DB_USERNAME, DB_PASSWORD, DB_NAME);

if(!$mysqli){
  die("Connection failed: " . $mysqli->error);
}

//query to get data from the table
$query = sprintf("SELECT playerid, score FROM score ORDER BY playerid");

//execute query
$result = $mysqli->query($query);

//loop through the returned data
$data = array();
foreach ($result as $row) {
  $data[] = $row;
}

//free memory associated with result
$result->close();

//close connection
$mysqli->close();

//now print the data
print json_encode($data);
Output of data.php file
To get the output of data.php file open it in your web browser (Chrome for instance)
URL: localhost/chartjs/data.php
[
   {
      "playerid":"1",
      "score":"10"
   },
   {
      "playerid":"2",
      "score":"40"
   },
   {
      "playerid":"3",
      "score":"20"
   },
   {
      "playerid":"4",
      "score":"9"
   },
   {
      "playerid":"5",
      "score":"20"
   }
]
Create bargraph.html file to display bar graph
Now create a new file inside chartjs project folder and name it bargraph.html this file is going to display bar graph.
File: bargraph.html
<!DOCTYPE html>
<html>
  <head>
    <title>ChartJS - BarGraph</title>
    <style type="text/css">
      #chart-container {
        width: 640px;
        height: auto;
      }
    </style>
  </head>
  <body>
    <div id="chart-container">
      <canvas id="mycanvas"></canvas>
    </div>

    <!-- javascript -->
    <script type="text/javascript" src="js/jquery.min.js"></script>
    <script type="text/javascript" src="js/Chart.min.js"></script>
    <script type="text/javascript" src="js/app.js"></script>
  </body>
</html>
Write some javascript in app.js
We will be making AJAX call from app.js file to data.php file to fetch the JSON data which will be used to draw the bar graph.
File: app.js
$(document).ready(function(){
  $.ajax({
    url: "http://localhost/chartjs/data.php",
    method: "GET",
    success: function(data) {
      console.log(data);
      var player = [];
      var score = [];

      for(var i in data) {
        player.push("Player " + data[i].playerid);
        score.push(data[i].score);
      }

      var chartdata = {
        labels: player,
        datasets : [
          {
            label: 'Player Score',
            backgroundColor: 'rgba(200, 200, 200, 0.75)',
            borderColor: 'rgba(200, 200, 200, 0.75)',
            hoverBackgroundColor: 'rgba(200, 200, 200, 1)',
            hoverBorderColor: 'rgba(200, 200, 200, 1)',
            data: score
          }
        ]
      };

      var ctx = $("#mycanvas");

      var barGraph = new Chart(ctx, {
        type: 'bar',
        data: chartdata
      });
    },
    error: function(data) {
      console.log(data);
    }
  });
});
Output
ADVERTISEMENT